Survey a set of spatial units to get summary statistics.
Source:R/st_survey_spatialunits.R
st_survey_spatialunits.RdSurvey a set of spatial units to get summary statistics.
Arguments
- x
a
sfobject withPOLYGONgeometries representing the spatial units to be surveyed.- trim
numeric; fraction (0 to 0.5) of values to be trimmed from the lower end to compute a trimmed mean.
- viz
binary; Displays a scatterplot of area distributions.
Examples
street_blocks <- st_create_streetblocks(x = bangalore_highways,
boundary = bangalore_boundary, merge_threshold = NULL, verbose = FALSE)
#> Warning: Small geometries (< 1 m^2) may be present. Use st_merge_spatialunits() to aggregate them.
survey_report <- st_survey_spatialunits(x = street_blocks)
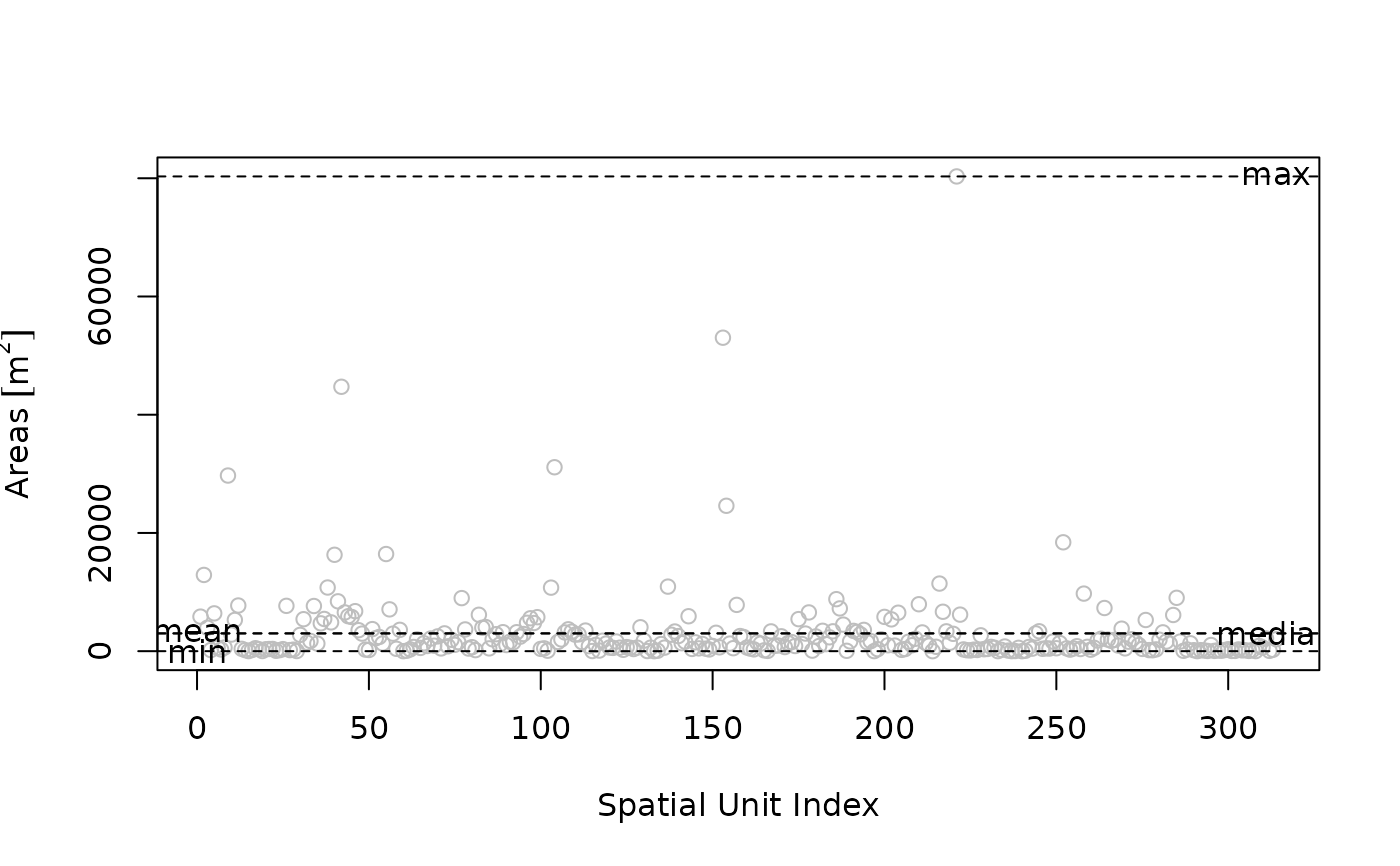 #> category description value
#> 1 Area Min 8.259066e-01 [m^2]
#> 2 Area Max 8.031008e+04 [m^2]
#> 3 Area Mean 3.006233e+03 [m^2]
#> 4 Area Median 3.006233e+03 [m^2]
survey_report
#> category description value
#> 1 Area Min 8.259066e-01 [m^2]
#> 2 Area Max 8.031008e+04 [m^2]
#> 3 Area Mean 3.006233e+03 [m^2]
#> 4 Area Median 3.006233e+03 [m^2]
#> category description value
#> 1 Area Min 8.259066e-01 [m^2]
#> 2 Area Max 8.031008e+04 [m^2]
#> 3 Area Mean 3.006233e+03 [m^2]
#> 4 Area Median 3.006233e+03 [m^2]
survey_report
#> category description value
#> 1 Area Min 8.259066e-01 [m^2]
#> 2 Area Max 8.031008e+04 [m^2]
#> 3 Area Mean 3.006233e+03 [m^2]
#> 4 Area Median 3.006233e+03 [m^2]